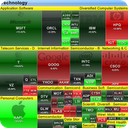
This app displays stock markets heatmaps :The color indicates the stock performance in percent. Based on the color you can identify losers (red), neutral (black), and gainers (green).Select:* S&P 500* World* ETFChoose Data:* YTD (= Year-to-date = since beginning of the year)* 1 Day* 1 Week* 1 Month* 3 Months* 6 Months* 1 Year* Relative Volume* P/E* Forward P/E (PRO version)* PEG ratio (PRO version)* Price/Sales (PRO version)* Price/Book (PRO version)* Dividend Yield (PRO version)* EPS Growth (last 5 years) (PRO version)* Float Short (%) (PRO version)* Analysts Recom. (PRO version)* Earnings Day Perfo (PRO version)* Earnings Day (PRO version)=> You can then SEND YOUR HEATMAP ('Share' icon at the top left corner)...
This app displays stock markets heatmaps :The color indicates the stock performance in percent. Based on the color you can identify losers (red), neutral (black), and gainers (green).Select:* S&P 500* World* ETFChoose Data:* YTD (= Year-to-date = since beginning of the year)* 1 Day* 1 Week* 1 Month* 3 Months* 6 Months* 1 Year* Relative Volume* P/E* Forward P/E (PRO version)* PEG ratio (PRO version)* Price/Sales (PRO version)* Price/Book (PRO version)* Dividend Yield (PRO version)* EPS Growth (last 5 years) (PRO version)* Float Short (%) (PRO version)* Analysts Recom. (PRO version)* Earnings Day Perfo (PRO version)* Earnings Day (PRO version)=> You can then SEND YOUR HEATMAP ('Share' icon at the top left corner) directly through Twitter, email, Facebook, etc...★★★ It is still under development, so please rate it accordingly ★★★ Please take a few seconds to SHARE the app on Twitter, Facebook, Google+ or any preferred venue as more downloads = we will spend more time to develop this app further!Thank You.WaveStock.comCharts and data are coming from FINVIZ - Thank you so much Alex.Copyright © 2010 FINVIZ.com. All Rights Reserved.keyword: heatmapper; heatmap, stocks, stocks app, stocks widget, stocks yahoo, wallstreet, wallstreet survivor